



How to Reduce Electronic Component Costs Without Compromising Quality
Table of Contents
Component costs represent 35-45% of total electronics manufacturing expenses. In 2026, manufacturers face dual pressure: reducing costs while maintaining quality amid supply chain challenges. This guide covers strategies that achieve 20-40% cost reduction while maintaining quality and delivery reliability.
Understanding Component Cost Structure
Electronic component costs include unit price, logistics, inventory carrying costs, quality verification, and counterfeit risk. The 5-15% premium for authorized distributors typically pays for itself through eliminated counterfeit risk and reduced verification costs.
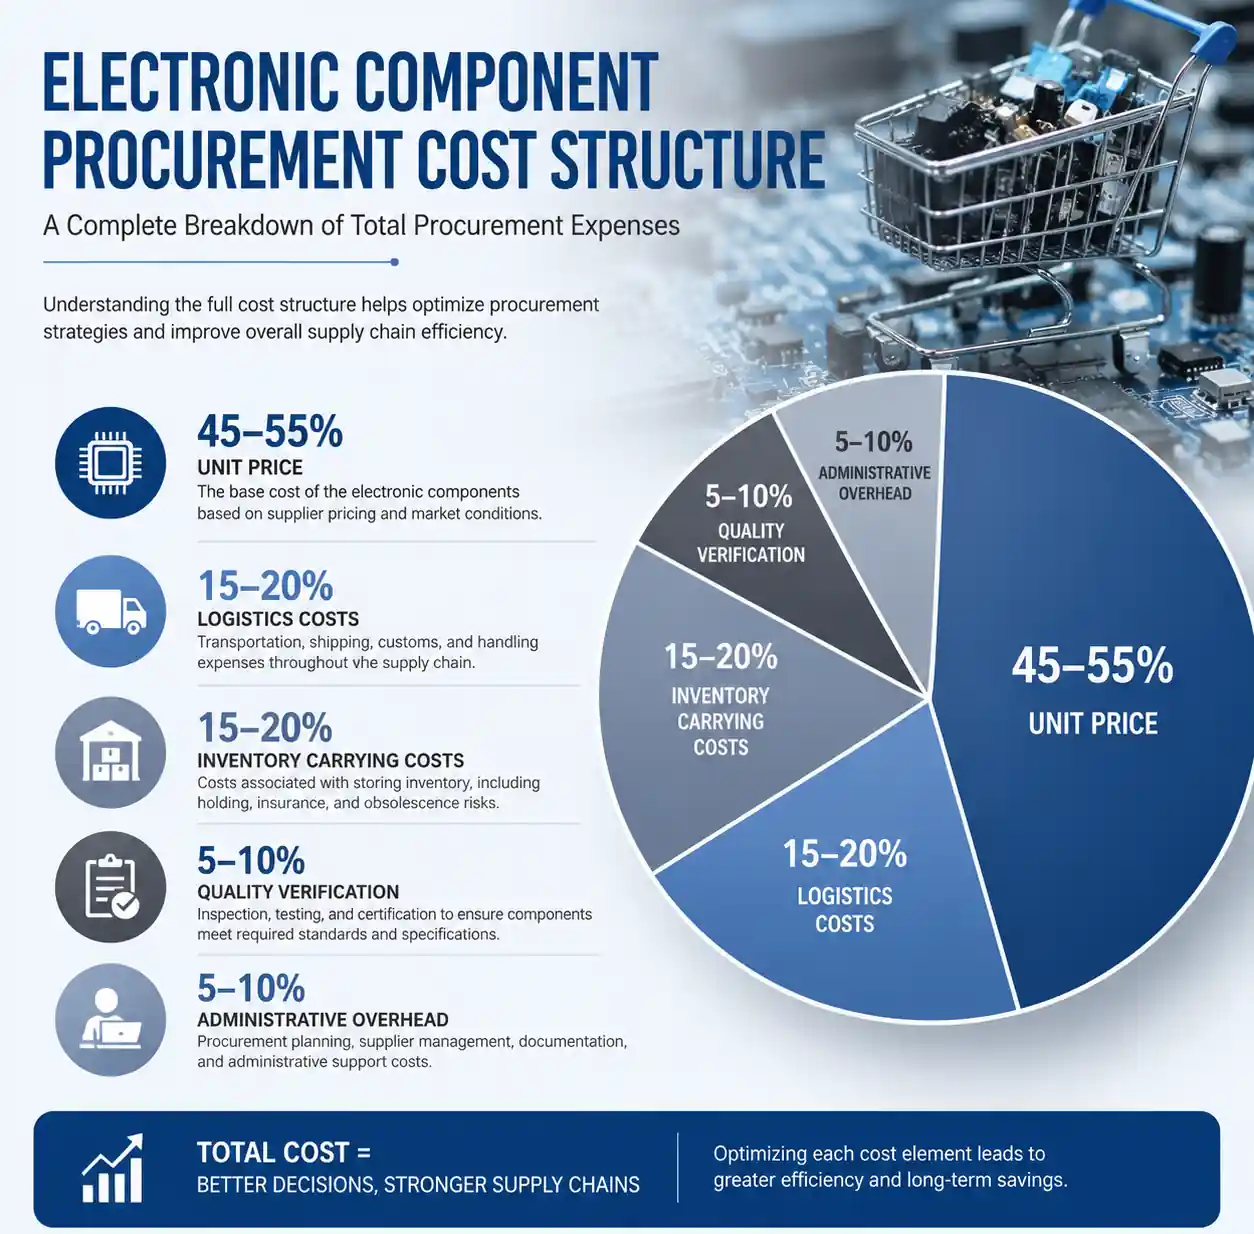 Electronic component total cost of ownership breakdown showing unit price, logistics, inventory carrying costs, and quality verification expenses
Market dynamics in 2026 show lead times stabilizing for most component categories, with standard ICs returning to 8-12 week delivery versus 20+ weeks during peak shortages. This normalization creates opportunities for strategic purchasing leverage.
Supplier Consolidation Strategy
Consolidating purchases with fewer authorized distributors delivers measurable cost reduction through volume leverage. Concentrating spend with 3-5 strategic partners instead of 15-20 suppliers unlocks tier pricing, improves payment terms, and reduces administrative overhead.
Volume-Based Pricing Benefits
Authorized distributors structure pricing in volume tiers. A manufacturer purchasing 1,000 units quarterly at $2.50 each can negotiate $1.85-$2.00 pricing by consolidating to 4,000 units quarterly. This 20-26% reduction requires no quality compromise.
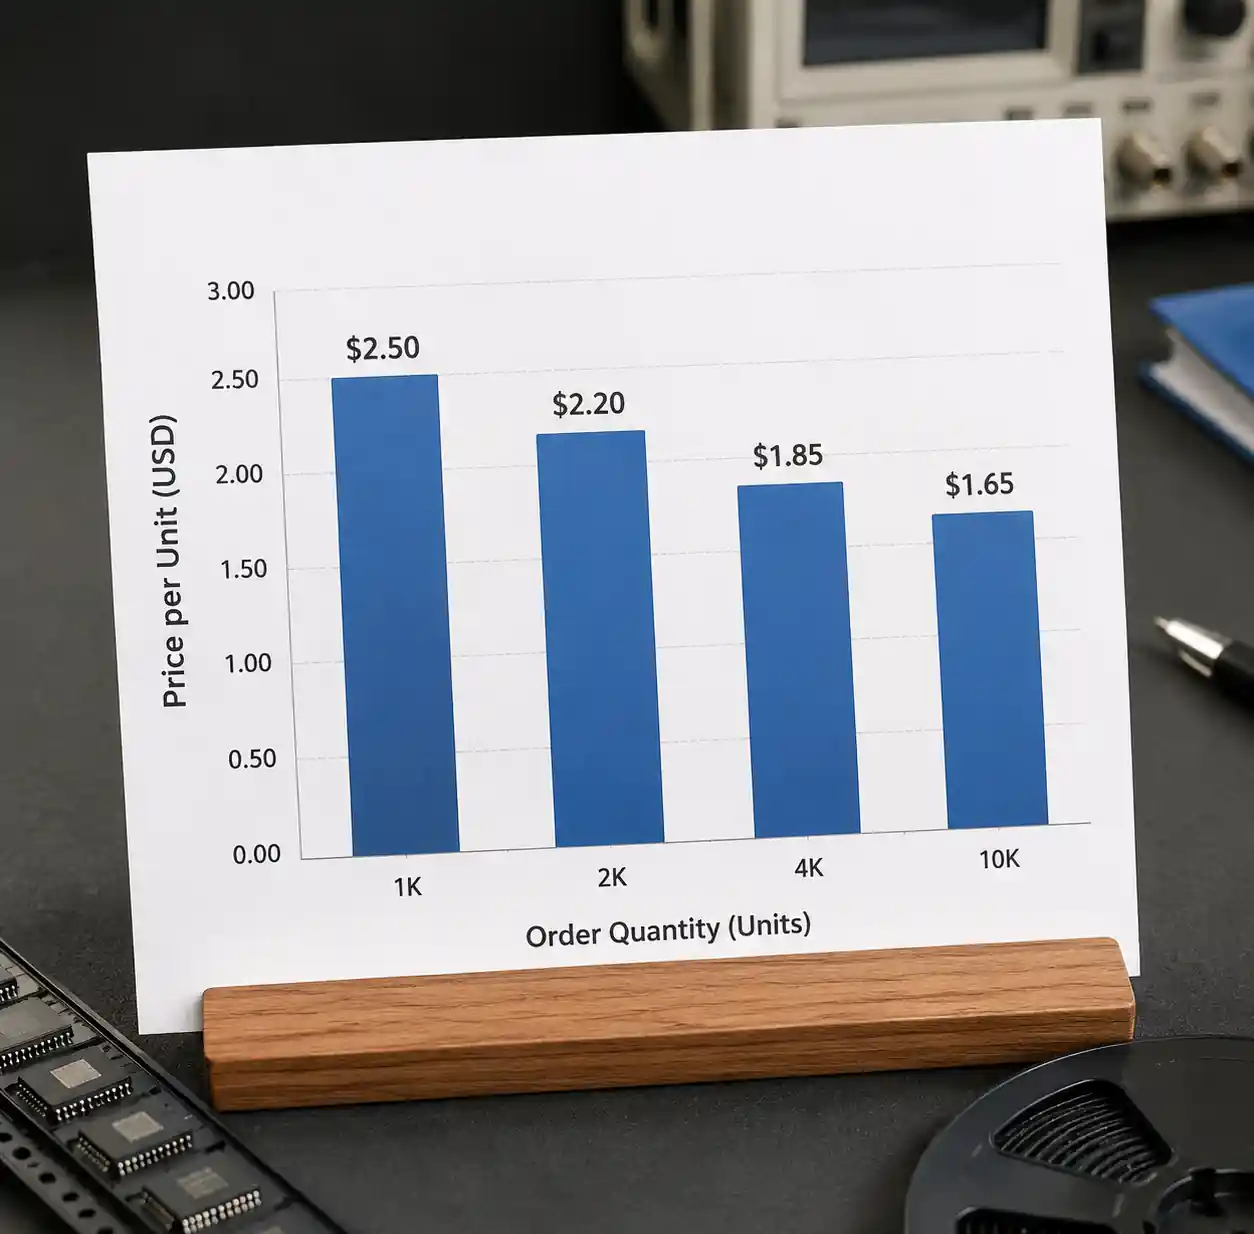 Volume-based pricing tiers comparison showing cost reduction through supplier consolidation strategy
Calculate consolidation opportunity by analyzing component spend across categories. Components from the same manufacturer families bought through multiple distributors represent immediate consolidation targets.
Negotiation Leverage Through Consolidation
| Metric | Before Consolidation | After Consolidation | Improvement |
|---|---|---|---|
| Active Suppliers | 18-25 distributors | 3-5 strategic partners | 75-85% reduction |
| Average Unit Price | Baseline 100% | 70-85% of baseline | 15-30% reduction |
| Administrative Hours | 160 hours/month | 40-60 hours/month | 60-75% reduction |
| Payment Terms | Net 30 days | Net 45-60 days | Improved cash flow |
Implementation Approach
Start consolidation with passive components where standardization across products is highest. Move to power management ICs and microcontrollers as you establish supplier relationships. Maintain 2-3 qualified sources for critical components to prevent concentration risk.
Authorized Distributor Partnerships
Authorized distributors cost 5-15% more in unit price but eliminate hidden costs of counterfeit components, quality failures, and supply chain risk.
True Cost of Gray Market Sourcing
Industry data shows 3-8% of gray market components are counterfeit or substandard. When a $2 counterfeit IC causes a $500 product failure, "savings" become a $498 loss. Authorized distributors provide manufacturer certificates of conformance, full traceability, and warranty protection.
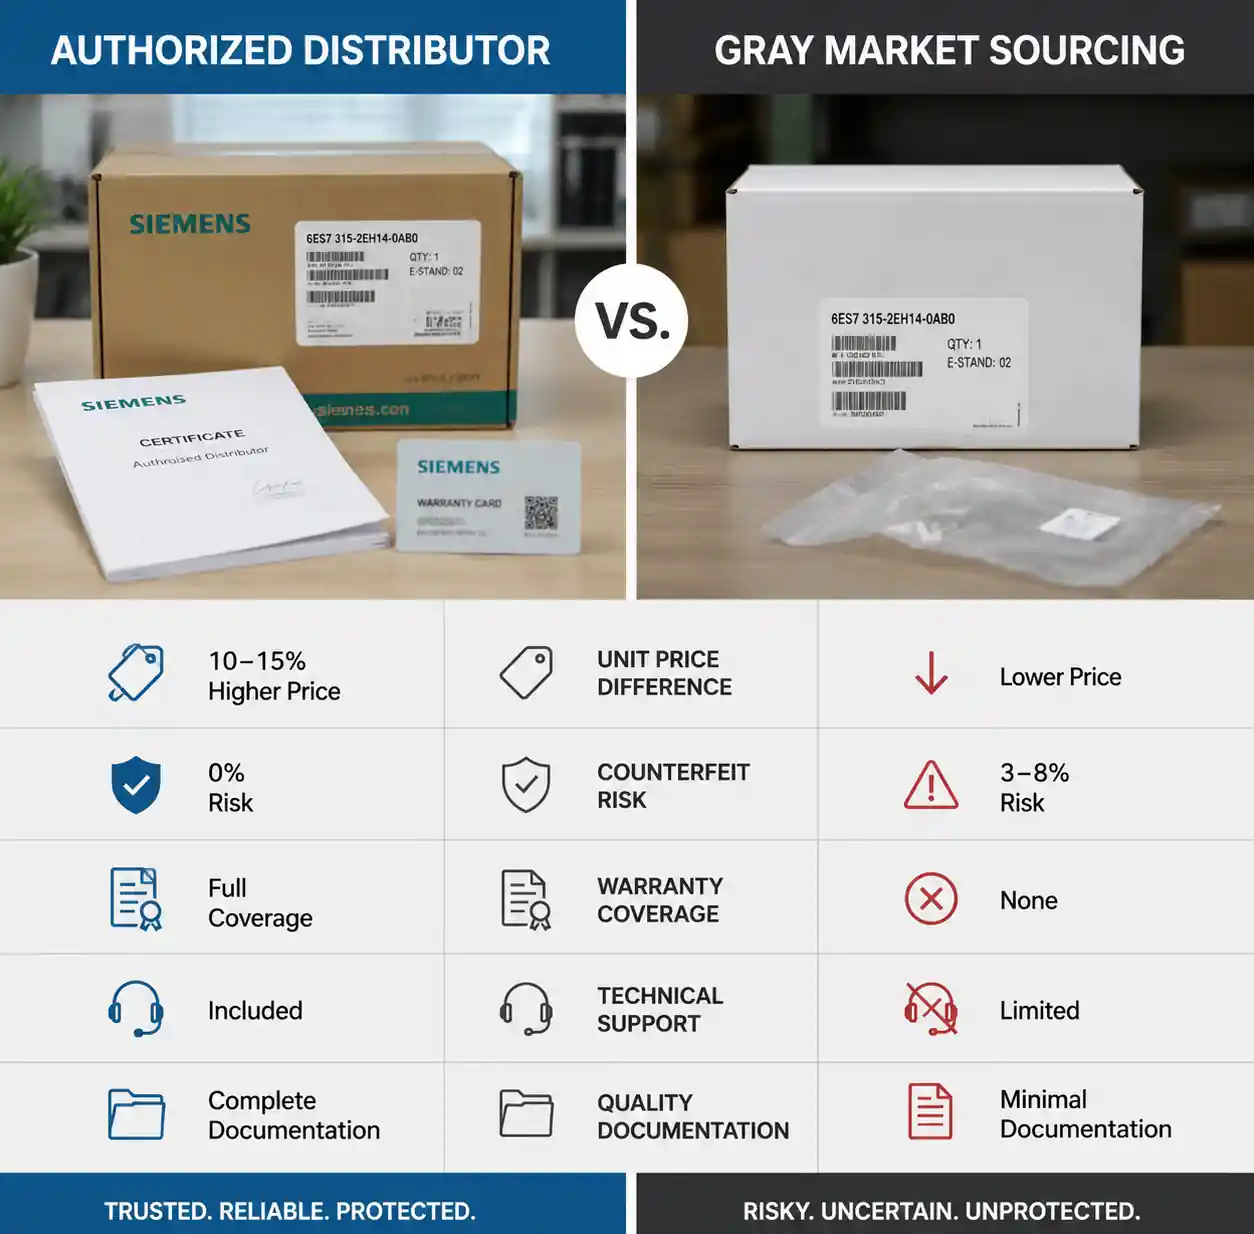 Authorized distributor versus gray market component sourcing cost-benefit comparison
Authorized Distributor Selection
Evaluate distributors on: manufacturer authorization, inventory depth, technical support, logistics, and financial terms. Request authorization letters verifying franchised distributor status. Compare payment terms—some offer net 60-90 days for strategic accounts.
Value-Added Services
Distributors offer tape and reel conversion, programming, kitting, and VMI programs. A distributor providing programmed microcontrollers eliminates your programming labor costs ($0.25-$0.75 per unit). Technical support prevents specification errors that cause costly redesigns.
Demand Forecasting and Inventory Optimization
Accurate forecasting reduces both excess inventory costs and emergency purchase premiums. Emergency purchases cost 25-50% premiums for expedited manufacturing and air freight.
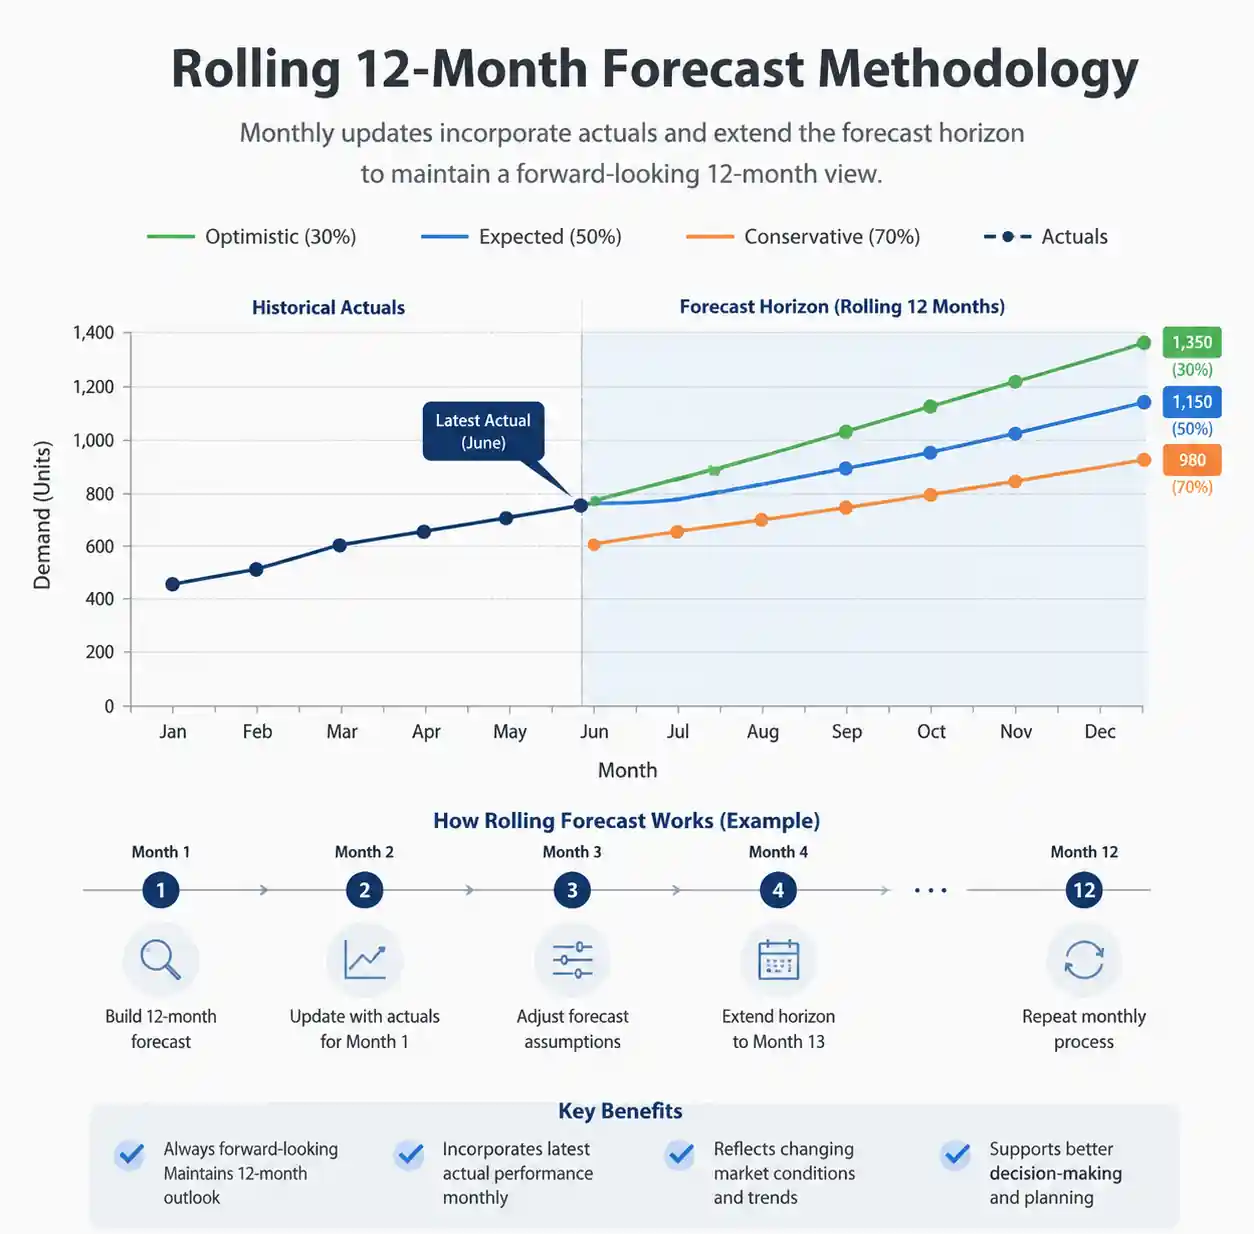 Rolling 12-month demand forecasting methodology for electronic component procurement planning
Forecasting Methodology
Implement rolling 12-month forecasts updated monthly. Use three-point estimates: conservative (70% probability), expected (50%), and optimistic (30%). Components with 12-week lead times need forecasting 16 weeks ahead to prevent rush orders.
Buffer Stock Strategy
Buffer Stock = (Max Daily Usage × Max Lead Time) - (Avg Daily Usage × Avg Lead Time). For 12-week lead times with stable demand, 3-4 weeks buffer provides 95% protection. Components with volatile demand need 6-8 weeks coverage.
Consignment and VMI Programs
Consignment inventory shifts carrying costs to suppliers while ensuring availability. VMI programs place inventory management responsibility with suppliers, monitoring consumption and replenishing automatically. These work best for high-volume commodity components.
Design for Cost Efficiency
Engineering decisions determine 70-80% of product costs. Engaging procurement early in design reviews prevents costly component choices.
Component Standardization
Standardizing components across product lines aggregates volume and simplifies inventory. Using the same 0.1µF capacitor in ten products instead of ten different specs increases purchase volume 10x and unlocks better pricing.
Multi-Source Component Selection
Specify components with multiple qualified sources. When selecting microcontrollers or power management ICs, verify at least two manufacturers offer pin-compatible alternatives. This enables rapid supplier switching during allocation or price increases.
Value Engineering Reviews
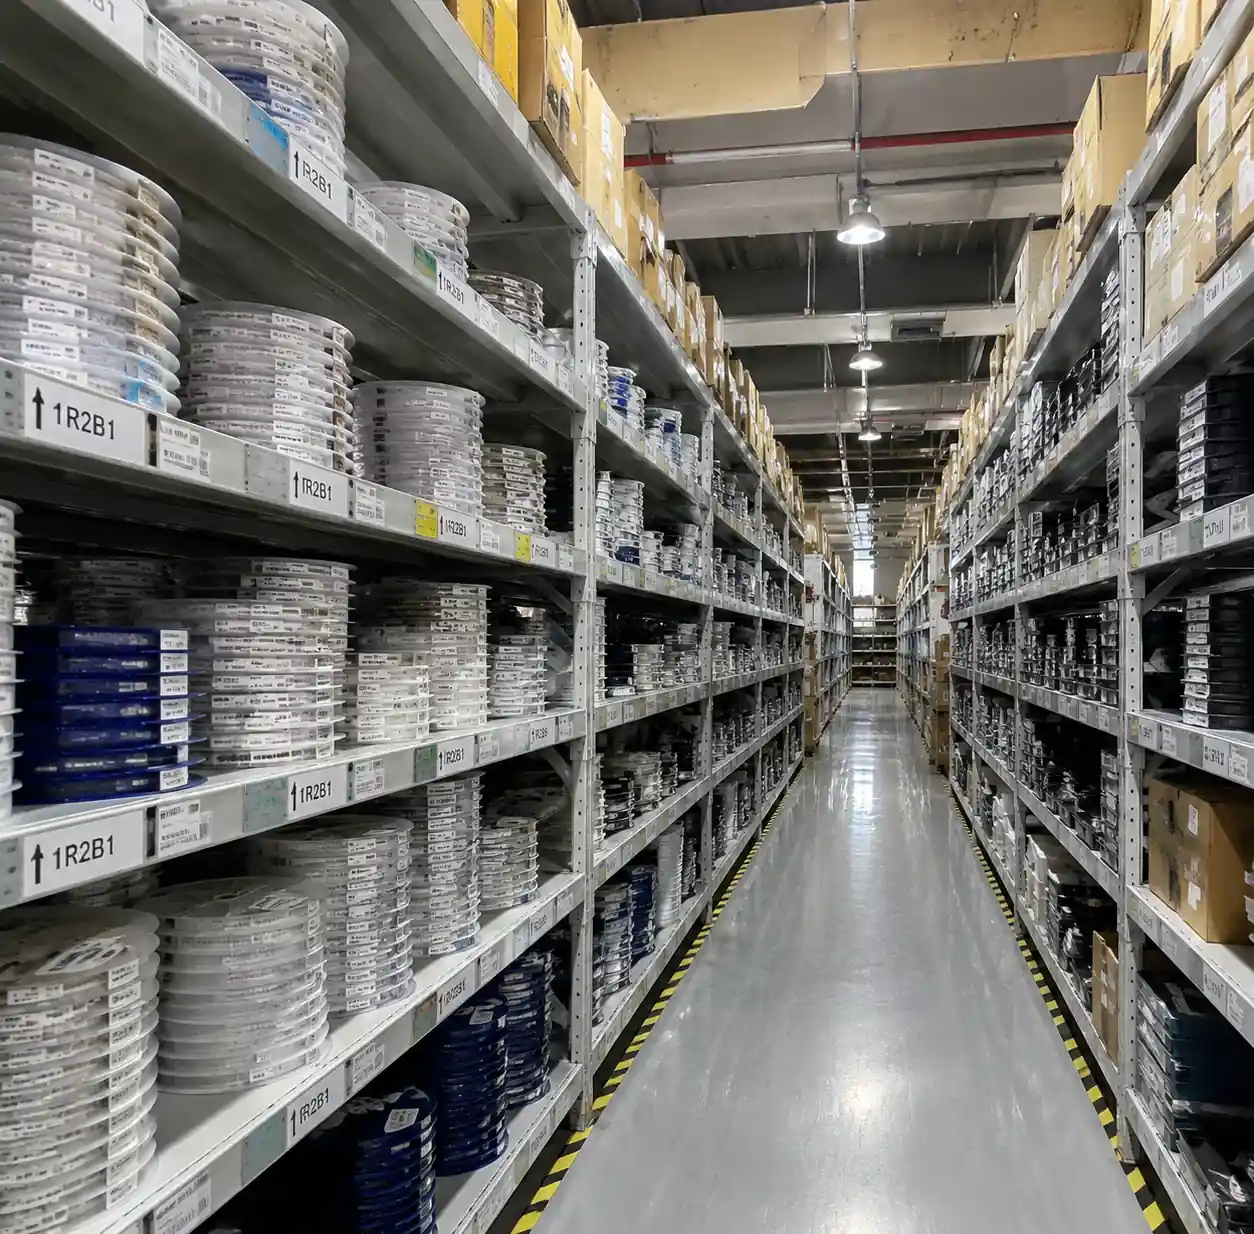 Asia electronic component sourcing and logistics operations showing warehouse and distribution
Conduct quarterly reviews examining BOM costs against specifications. Challenge component choices: Does a $5 ADC need 16-bit resolution or would 12-bit at $2 suffice? Are automotive-grade components needed for industrial applications where commercial-grade suffices?
Regional Sourcing Strategies
| Region | Unit Cost | Logistics | Best Use Cases | Lead Time |
|---|---|---|---|---|
| Asia | Lowest (80-90% of NA) | 3-5 weeks freight | High-volume, cost-sensitive products | 8-12 weeks |
| Europe | Moderate (95-105%) | 1-2 weeks regional | Automotive, EU market products | 10-14 weeks |
| North America | Baseline 100% | 1-5 days domestic | Aerospace/defense, prototypes, quick-turn | 8-12 weeks |
| Southeast Asia | Low-Moderate (85-95%) | 2-4 weeks freight | Regional manufacturing | 10-16 weeks |
Asia Sourcing
Asia offers 15-25% savings on passives and 10-20% on ICs. However, ocean freight adds 3-5 weeks and requires MOQs. Work with authorized distributors who maintain local inventory and provide English technical support.
Balancing Cost and Risk
Source high-volume commodities from Asia. Purchase allocated and specialized ICs from North American or European distributors where relationships and allocation access matter more than price. Prototype production benefits from domestic sourcing despite higher costs.
Quality Verification Without Premium Costs
Tiered Verification
Apply verification based on risk level. Components from authorized distributors need only receiving inspection. Gray market sources require full authentication including visual inspection, electrical testing, and material analysis.
 Electronic component quality verification and inspection process showing testing equipment and procedures
Cost-Effective Testing
Visual inspection under 20-40x magnification detects most counterfeits. Examine markings for consistency, print quality, and alignment. Electrical testing verifies datasheet specifications. Curve tracer analysis compares pin-to-pin characteristics against known-good references ($50-150 per type).
Supplier Quality Agreements
Require certificates of conformance, traceability, and material compliance certificates. This shifts authentication burden to suppliers while providing audit trail.
Lead Time Management
Lead Time Tracking
Monitor actual lead times for key components and compare against distributor quotes. Create dashboards for components representing top 80% of BOM cost. Update monthly based on purchase orders and supplier communications.
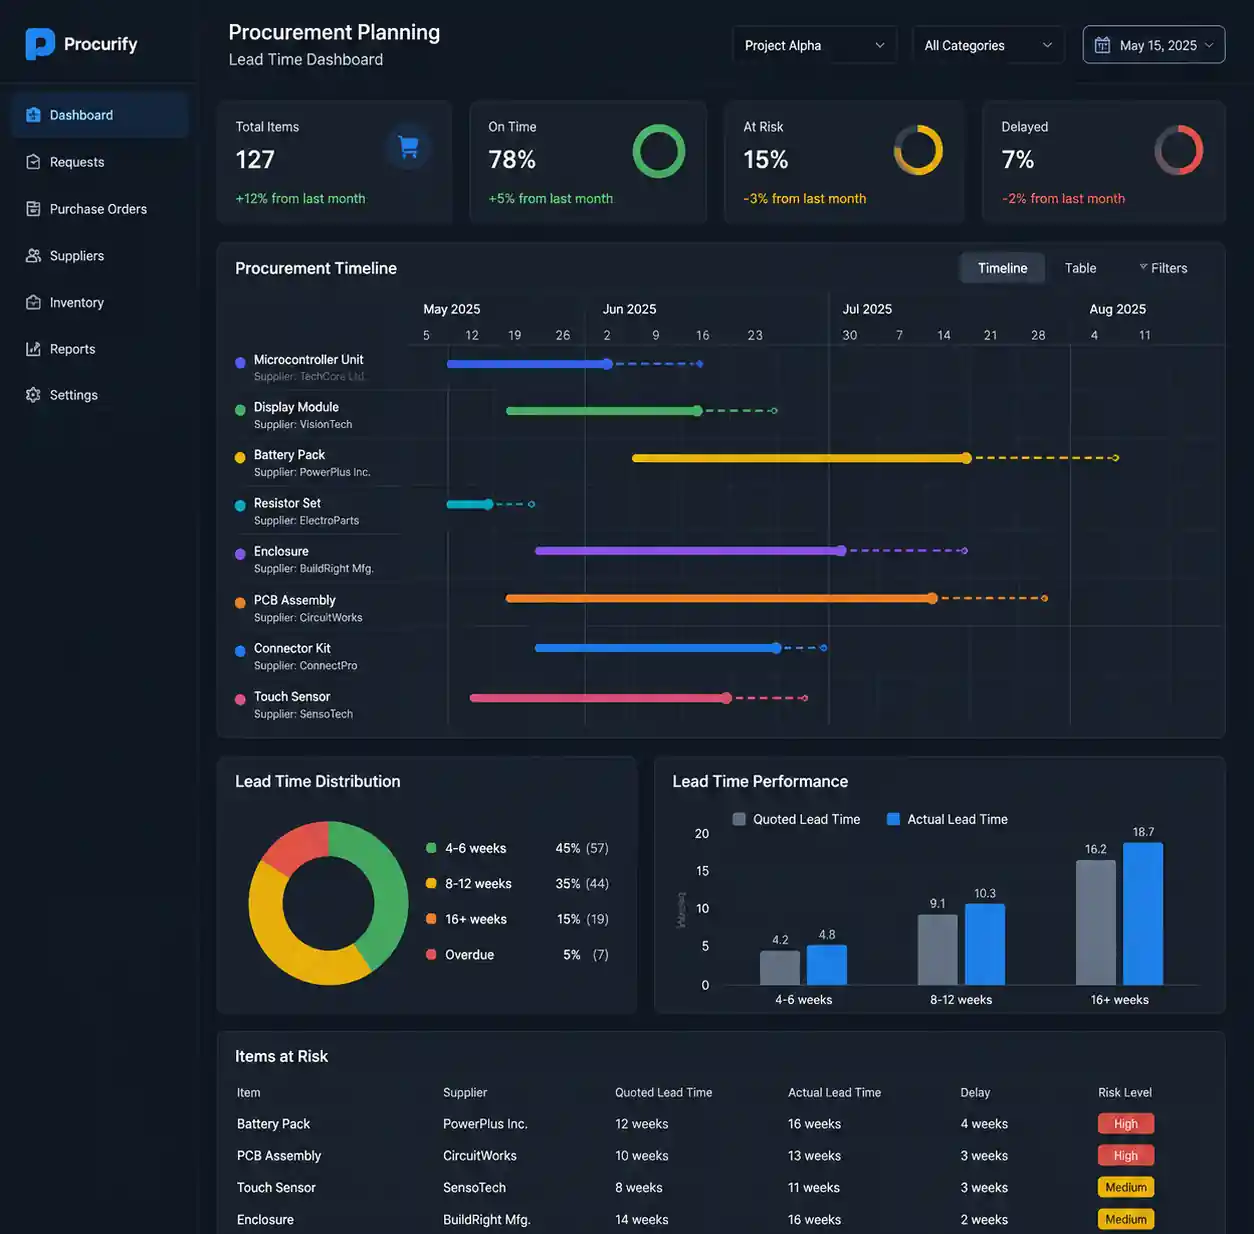 Lead time tracking dashboard showing component procurement planning and delivery timeline monitoring
Strategic Inventory Positioning
Components with 16+ week lead times need 8-12 weeks strategic inventory. Calculate break-even where carrying costs equal emergency purchase premiums. If carrying costs run 25% annually and emergency purchases cost 40% premiums, 6 months inventory breaks even with two emergency purchases yearly.
Allocation Management
During allocation, distributor relationships determine supply access. Companies consolidating spend with strategic distributors receive priority allocation. Submit 12-16 week forecasts during allocation periods—forecast accuracy builds distributor confidence and improves allocation priority.
FAQ
How much cost reduction is realistic without compromising quality?
Companies implementing comprehensive strategies typically achieve 20-30% savings in the first year through supplier consolidation, forecasting improvement, and value engineering. Additional 5-10% savings come from regional sourcing optimization over 18-24 months.
Should I work with authorized distributors or independent brokers?
Authorized distributors cost 5-15% more but eliminate counterfeit risk, provide warranties, and offer technical support. This premium costs less than quality verification overhead and counterfeit failures. Use brokers only for obsolete components unavailable through authorized channels.
What's the optimal number of suppliers for balancing costs and risk?
Maintain 3-5 strategic authorized distributor partners for 80% of spend, with 2-3 qualified sources for critical components. This delivers volume leverage while preventing single-source risk.
How do I reduce costs for components currently on allocation?
Focus on forecast accuracy, early commitment to distributors, and design alternatives. Submit 12-16 week forecasts to secure allocation. Qualify second-source components and consider last-time-buy opportunities.
How can small manufacturers negotiate better pricing without high volumes?
Join purchasing consortiums aggregating volume across small manufacturers. Consolidate spend with fewer distributors. Emphasize forecast reliability and payment term flexibility over absolute volume. Distributors value predictable customers who pay promptly.
Conclusion
Reducing electronic component costs without compromising quality requires strategic approaches across supplier relationships, procurement processes, and design decisions. Supplier consolidation, authorized distributor partnerships, demand forecasting, and design optimization deliver 20-40% cost reduction while maintaining quality and supply chain reliability. Implementation starts with analyzing spend patterns, identifying consolidation opportunities, and building relationships with authorized distributors who can support your volume growth.
If you need reliable electronic component sourcing with global supply network support, Hitop Tech offers comprehensive procurement services across Asia, Europe, North America, and Africa. Our authorized distributor relationships and quality verification processes ensure authentic components and on-time delivery through strategic supplier consolidation. Contact us today for component sourcing solutions and supply chain optimization.